

Uplands
(non floodplain)
Riparian upland habitats not in FEMA designated floodplains are primarily regulated by local units of government through zoning ordinances. Each local government unit may or may not enact riparian regulations to safeguard its wetlands and waterways. In the Black and Paw Paw River Watersheds there are over 30 municipalities that can significantly impact water quality depending on how they choose to regulate development along the riparian corridor of its waterways.
Management and Regulation
Michigan’s Natural Resources and Environmental Protection Act Part 301, Inland Lakes and Streams (Legislation Link, EGLE Link), and Part 91, Soil Erosion and Sedimentation Control (Legislation Link, EGLE Link) of the same act provides some indirect protections to riparian habitats as described below but it is limited in scope and not specifically targeted at protecting riparian habitat.
-
Part 301, Inland Lakes and Streams protects natural resources and the public trust waters of the inland lakes and streams in the state by regulating activities including dredging, filling, constructing or placement of a structure on bottomlands (below ordinary high water mark (OHWM)), constructing or modification of a marina, interfering with the natural flow of water or connecting a ditch or canal to an inland lake or stream.
-
Part 91, Soil Erosion and Sedimentation Control provide for the control of soil erosion and protects adjacent properties and waterways from sedimentation. A permit is generally required for any earth change activity which disturbs one or more acres of land or which is within 500 feet of a lake or stream.
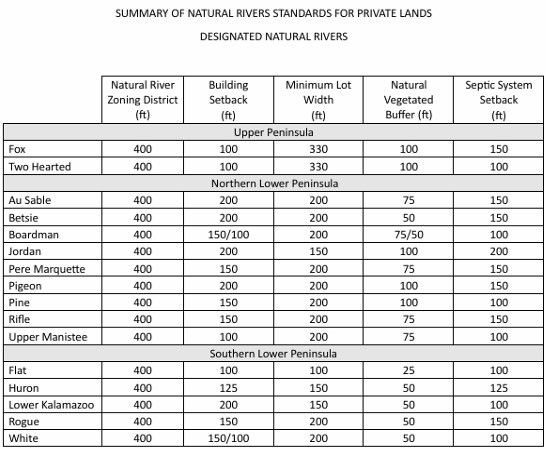
Michigan’s Natural Resources and Environmental Protection Act Part 305, Natural Rivers (Michigan's Natural Rivers, NREPA Part 305) is a statewide regulatory effort to protect the natural quality of select river systems by regulating their use and development through local zoning rules. The Natural Rivers Program was developed to preserve, protect and enhance our state's finest river systems for the use and enjoyment of current and future generations by allowing property owners their right to reasonable development while protecting Michigan's unique river resources.
The table on the right shows zoning standards for Natural Rivers and the designation includes the mainstream, as well as most of the tributaries. Nearly all construction, land change / earth moving, and placement of structures is regulated within a 400-feet zoning district of any designated stream segment.
It is worth noting that the Paw Paw River was on a list for consideration into the Natural Rivers Program at some point in the past, yet there is no readily available information as to why it was removed.

Michigan State University Extension published a scientific summary paper (Reilly, Mary, 2023) providing zoning guidance to help communities meet goals around water quality and protection of natural resources.
It stated that “Proactive protection of wetlands and surface water is often an issue of how the shoreline is treated: setbacks, vegetative buffers, and density of development.”
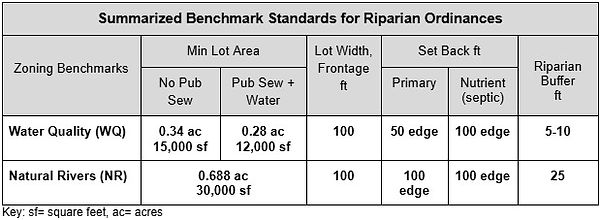
The zoning guidance provided in the paper is listed in the table on the left and offers some science-based standards for use in local government zoning.
The Michigan Natural Rivers program and the MSU Extension zoning recommendations share locally controlled ordinances that aim to control density (minimum lot size and width) and development (setbacks and buffers) along the riparian corridor in order to reduce nonpoint source pollution and protect water quality. Michigan’s Natural Rivers program is targeted at more broadly protecting rivers while Michigan State University Extension’s minimum standard is designed to meet water quality goals with additional standards to target other specific goals.
By comparing the current zoning ordinances in the Black and Paw Paw River Watersheds to the MSU Extension’s minimum water quality (WQ) benchmark we can assess if the local municipalities are meeting this standard. In addition, if we adopt the minimum Natural Rivers (NR) zoning standards for the southern lower peninsula (Flat River) as a broader riparian and water quality protection benchmark, we can also assess if local municipalities are meeting these stronger protections. Combined, this comparison would help identify strengths and opportunities for improvements in zoning ordinances along the watershed’s riparian corridor for protecting water quality.
The table on the right summarizes the MSU Extension and Michigan Natural Rivers zoning ordinance standards for this comparison. It shows the MSU Extension water quality standard and the Natural Rivers minimum standard for the southern lower peninsula which was for the Flat River. The MSU Extension water quality benchmark will serve as the minimum standard to be met while the Natural Rivers standards will serve as the stronger, broader standard to be met.
Local Zoning Assessment
The map images and tables show the results of this assessment of current zoning ordinances (2025) for most of the watershed townships and several of the municipalities against MSU Extension Water Quality and minimum Natural Rivers for four of the benchmark ordinances: minimum lot area, minimum lot width, primary structure setback and riparian buffer.
The nutrient (septic) setback ordinance benchmark is implemented at the county level and is listed below by county. Only waterways in Allegan County (northern half of the Black River watershed) meet the 100-foot nutrient source setback from the water's edge benchmark for both MSU Extension Water Quality and Michigan Natural Rivers.
-
Allegan County - 100 ft from a lake or stream
-
Van Buren County - 50 ft for private single family homes, 100 ft for all other
-
Berrien County - 50 ft from a lake or stream
-
Kalamazoo County - 50 ft from a lake or stream
Failing septic systems are a reported cause of E. Coli pollution in our waterways. TRC sampled several waterways in the Paw Paw and Black River Watersheds for E.Coli from 2017-2022 and found that it was not uncommon to have E.coli values exceeding minimum standards for partial and total body contact designated uses. EGLE’s statewide data (which includes TRC data) suggests that about 50% of the state’s rivers and streams do not meet E. Coli water quality standards. The larger septic system setbacks may help reduce bacterial pollution from reaching the waterways and improve designated uses for partial and total body contact.
The assessed river sections were color coded based on which standards they met; blue = meets or exceeds Natural Rivers, green = meets or exceeds Water Quality, yellow = unknown or multiple zones, and red = did not meet water quality.
Minimum Lot Area:
-
67% met Water Quality (7%) or Natural River Status (60%)
-
33% - unknown (24%) or did not meet water quality (9%) benchmark
The minimum lot area ordinance helps control density of developments and in 67% of the river miles assessed the river had minimum lot area ordinances that met or exceeded the Natural Rivers minimum for the southern lower peninsula (0.69 acres) or the water quality benchmark (0.28-0.34 acres).
There are at least 25 different minimum lot area ordinances in the assessed areas of the watersheds with 1 acre being the most prevalent.

Minimum Lot Width:
-
67% met Water Quality (0%) or Natural River Status (67%)
-
33% - unknown (24%) or did not meet water quality (9%) benchmark
Like the minimum lot area ordinance, the minimum lot width ordinance helps control development density. In 67% of the river miles assessed the river had minimum lot width ordinances that met or exceeded the Natural Rivers minimum (100 feet) as well as the water quality benchmark which are equal for minimum lot width.
There are at least 19 different minimum lot width ordinances in the assessed areas of the watersheds with 150 feet being the most prevalent.

Primary Setback:
-
39% met Water Quality (30%) or Natural River Status (9%)
-
61% - unknown (14%) or did not meet water quality (47%) benchmark
The primary structure setback ordinance regulates how close the primary structure can be to the edge of a waterway. In the assessed waterways, only 39% of the river miles met Natural Rivers (100 feet) or water quality minimum (50 feet) standards while 61% did not meet the minimum water quality standard or were unknown with multiple ordinances.
There are at least 11 different primary setback ordinances in the assessed areas of the watersheds with 50 feet being the most prevalent.

Riparian Buffer Width:
-
9% met Water Quality (0%) or Natural River Status (9%)
-
91% - unknown (6%) or did not meet water quality (85%) benchmark
Riparian buffer or protection ordinances are generally aimed at protecting water quality and natural resources along waterways. In the assessed waterways, only 9% of the river miles met the minimum water quality (5 feet) or Natural River (25 feet) benchmarks. About 85% of the river miles did not meet minimum water quality benchmarks and 6% were unknown / multiple ordinances.
There are essentially 4 different riparian buffer width ordinances in the assessed areas of the watersheds with 0 feet being the most prevalent.

Conclusion
This comparative assessment focused mostly on second order and greater streams (larger streams) and rivers in the watersheds. We approached the assessment as a sampling of rivers and streams in each township and not a complete sampling. In some cases we may have assessed first order streams to get some stream miles for a township or to complete a stream started in another township. The goal was to get a picture of how the overall watersheds fared against these MSU Extension and Natural Rivers benchmarks.
It is worth noting that this assessment did not take into consideration regulations for designated floodplains or Part 303 wetlands along the waterways unless they impact the values of the ordinances. This assessment simply compared the current ordinance values against benchmark standards with no visibility to on the ground habitat. For example, some river miles not meeting the water quality benchmark standards could be protected by wetlands and/or floodplain regulations and this would not be captured.
Ordinances for each township and local municipality were reviewed during the later half of 2025. In general, the assessment followed these steps:
-
Locate the official zoning map and determine which zones or districts were impacted by the second order and greater rivers or streams passing through or adjacent to them.
-
Determine what the values were for the four benchmark ordinances for each zone or district impacted.
-
Compare these values to the MSU Extension and Natural Rivers benchmarks and determine if they met these benchmarks or not.
-
Using ARCgis Pro 3.6.1 software, map out each stretch of river or stream in each zone or district and code for whether it meets, exceeds, unknown or multiple ordinances, or does not meet benchmarks.
As we conducted these assessments and built these maps, several issues were noted. For one, townships store their ordinances differently and in different formats which creates challenges locating the ordinances needed for review. Another issue is the terminology can differ between townships. For example, some use the front yard setback ordinance for waterfront lots while others might use rear yard and in some cases there is no indication which applies to a waterfront lot.
In many cases, the ordinances were not written with regard to riparian habitat. Lot widths and primary structure setbacks were rarely specific for ordinary high water marks unless there was a lake front. If a stream passes through a lot inside of property boundaries (not forming a property line), it is unclear if setbacks to the waterway would apply if not specific for the ordinary high water marks. To overcome some of these issues, we assume the minimum lot width and primary structure setbacks apply to the ordinary high water mark or riparian area. Very few ordinances make note of a riparian buffer requirement and some of these ordinances do not give a specific value (feet). The riparian buffer was assumed to be 0 feet if not noted in an ordinance and 1 foot if recommended but not specifically defined .
The comparative assessment results show the watersheds fared well when it came to density of developments on the riparian areas. Both minimum lot area and lot width showed about 67% of the river miles assessed met or exceeded MSU Extension water quality or Natural River standards. Development near the riparian habitat fared much less with only about 39% of the assessed river miles for primary setback and only 9% for the riparian buffer ordinances meeting or exceeding the MSU Extension water quality benchmark.
Given the important role that riparian buffers play in protecting water quality, reducing the impact of nonpoint source pollution, and protecting natural resources it is surprising to see only three townships with a riparian buffer ordinance. Only the townships of Almena and Antwerp had riparian ordinances that met MSU Extension water quality and Michigan Natural Rivers benchmarks.
Explore our Riparian Buffers webpage to learn more.